TRIDEEP DEY DATA ANALYST
GURUGRAM & BANGALORE INDIA
PULL DOWN OR CLICK TO ENTER

PORTFOLIO

I BUILD DATA PIPELINES
THAT TURN MESSY DATA
INTO CLEAR DECISIONS.

PULL DOWN OR CLICK TO ENTER
Data Analyst · Gurugram & Bangalore

I find the problem in your data,
and build the system to fix it.

I connect messy databases, automate hours of manual spreadsheet work, and build dashboards that leaders can trust every morning.

0% Less manual reporting Replaced spreadsheets with automated feeds
0% Higher client conversion Through clear campaign analytics
0+ Automations shipped Python scripts, ETL jobs, and API syncs
0 Databases unified MySQL + MongoDB into BigQuery
Zyla Health Logo Zyla Health · Healthcare · Data Analyst
Current Role

Automating Healthcare Reports & Live Dashboards

The Problem

Patient vitals and clinical records were scattered across MySQL and MongoDB in inconsistent formats. Leadership and doctors had to wait on manual spreadsheet exports to track patient risks and program performance.

What I Did

Built an automated ETL pipeline that pulls from both databases, cleans the data, and loads it into BigQuery every morning. Created live Power BI dashboards that doctors and managers use daily, cutting manual reporting time by 60%.

Python MySQL MongoDB Google BigQuery Power BI
CredResolve Logo CredResolve · Fintech · Data Analyst
2023 – 2024

Finding Leaks in Acquisition Campaigns & AI Callers

The Problem

Marketing money was being spent, and AI voice agents were making debt collection calls, but no one had clear tracking on which marketing channels worked or whether the voice bots were converting or failing.

What I Did

Ran the numbers end-to-end and built automated daily performance dashboards. Lowered cost per lead by 15%, increased conversions by 25%, and saved a full working day of manual tracking each week.

Python SQL Power BI Google Cloud API Data Sync
1. Raw Databases
MySQL
MySQL User profiles & billing
MongoDB
MongoDB Vitals logs & time-series
Incremental Extract
2. Cloud Storage
GCS
GCS Bronze Raw Parquet files
Clean & Dedup
3. Warehouse
BigQuery
BigQuery Clean, structured tables
Daily Refresh
4. Reports
Power BI
Power BI Ready by 9:00 AM daily
Real edge-cases I resolved inside this pipeline:
MongoDB Float Bug

Decimal numbers in MongoDB turned into NULL values during export. Added type-checking guards to keep every ID intact.

Messy Timestamps

Some sources saved Unix seconds, others saved ISO strings. Normalized everything to standard UTC at extraction.

Unexpected Schema Changes

App developers added and renamed database columns without warning. Added schema-drift detection so bad data never reaches reports.

Safe Rollbacks

If a network drop happened halfway through an upload, the pipeline safely rolls back so half-written numbers never pollute dashboards.

01

Business First, Code Second

I come from commerce (B.Com background). Before writing SQL or Python, I understand the business: what moves revenue, what cuts cost, and what decision someone needs to make. Code is just the tool to get there.

02

Dashboards Must Answer "What Next?"

A dashboard shouldn't just show what happened yesterday. It should tell the manager or executive what to do tomorrow. If a chart doesn't lead to an action, it shouldn't be there.

03

Automate Whatever Repeats

Manual reporting wastes time and introduces mistakes. If a report or data pull has to be done more than once, I build a script to do it automatically so the team can focus on real work.

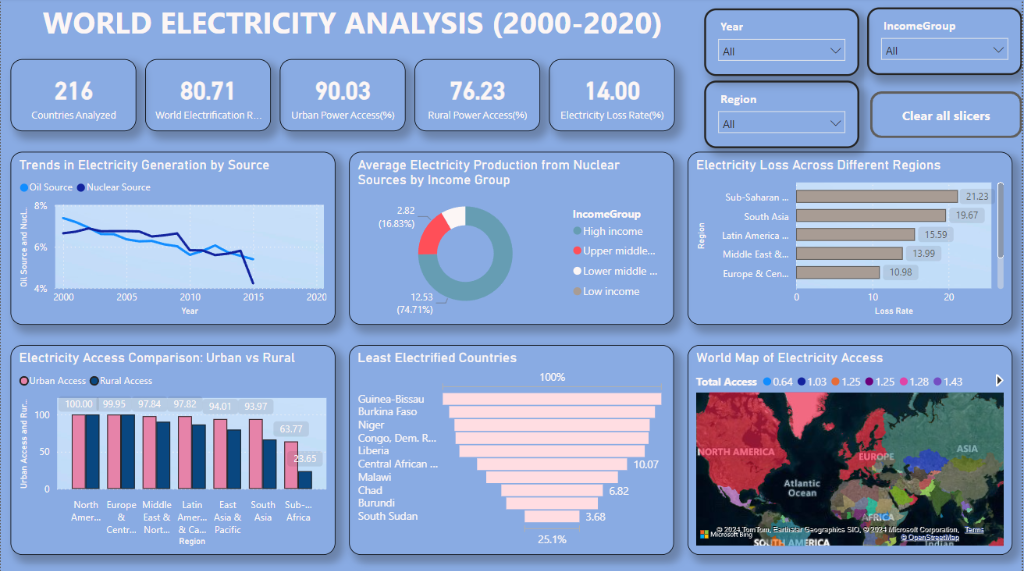
World Electricity Access Dashboard
World Bank Data · 216 Countries 21% Power Loss

World Electricity Access & Power Loss

Analyzed global electricity data across 216 countries. Found that Sub-Saharan Africa loses over 21% of its electricity during transmission before it even reaches homes. Built an interactive Power BI map to explore infrastructure gaps.

Python Power BI Pandas
View on GitHub →
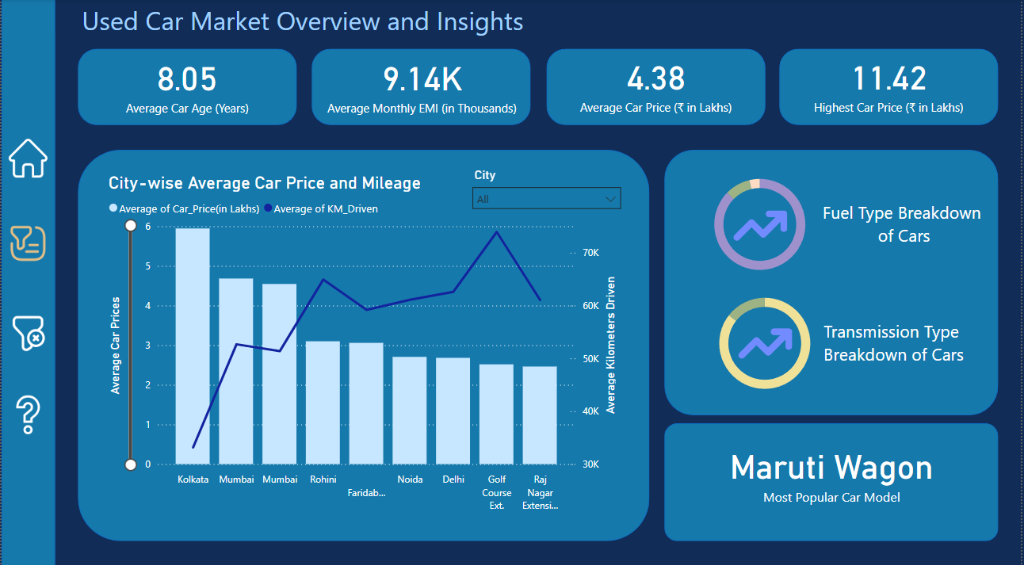
Cars24 Price Analysis Dashboard
Cars24 Dataset · Pan-India 40% Price Gap

Used Car Price Trends Across Indian Cities

Analyzed used car sale prices across India. Discovered that the exact same car model with identical mileage sells for up to 40% more in Mumbai compared to Kolkata, purely due to city-level supply and demand differences.

Python Pandas Power BI
View on GitHub →

I'm Trideep. I started with a commerce degree (B.Com), which gave me an understanding of finance, costs, and how businesses operate. From there, I got into data and automation—and never looked back.

Over the last 1.5+ years, I've built 50+ pipelines and automations. I spend my time writing clean SQL queries, Python scripts, connecting APIs, and building dashboards in Power BI.

I like taking messy, complicated data problems and making them simple, fast, and automated.

Technologies I use daily:
Python SQL Google BigQuery Google Cloud (GCS) MySQL MongoDB Power BI & DAX n8n Automation Docker
Quick Facts
Role: Data Analyst
Experience: 1.5+ Years
Automations Built: 50+ Shipped
Location: Gurugram / Bangalore, IN
Availability: Open to Roles
HackerRank HackerRank

SQL (Basic)

Queries, aggregations, filters, and multi-table joins.

View Certificate →
HackerRank HackerRank

SQL (Intermediate)

Subqueries, window functions, and complex joins.

View Certificate →
Anthropic Anthropic

Claude Code in Action

AI assistant architecture, MCP servers, and context workflows.

Masai School Masai School

Data Analytics Program

1800+ hours full-time intensive data analysis and reporting.

View Certificate →
TrendyTech TrendyTech

Big Data Masters

6 months training on Spark, SQL, and large-scale data systems.

View Certificate →
07 // Contact

Have a data problem or an open role?
Let's talk.

I'm open to full-time data analyst roles, analytics dashboard projects, and consultations. Reach out directly below:

Let's connect

Based in Gurugram / Bangalore, working with teams across India and remotely worldwide.

Send Email